Brain
Without a human eye and brain there is no color.
How can perception guide us toward understanding the brain.
To Understand the brain we must start with neurons.
The Exploratorium Biology department imaging station has an introduction to the development of a zebrafish brain with images of neurons.
Check out all three pages showing the initial discovery of neurons, the image of a zebrafish neuron and the development of connections between neurons.
http://www.exploratorium.edu/imaging-station/research/neurons/story_neurons1.php
BrainU
These animations on the BrainU site give clear explanations of complexities of the neurons.
Titles include Action Potential, The Synapse, Synapses Change (associated with learning), and Toxins and Synapses.
http://brainu.org/movies
Model of an neuron.
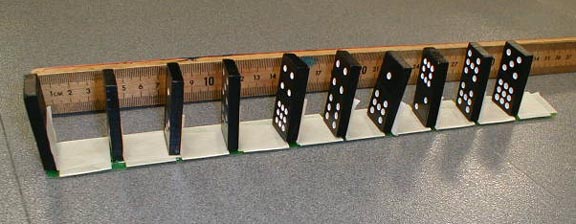
Domino Model of a Nerve TI Workshop
A signal will not start in this model of a neuron until the first domino is tipped beyong its "tipping point,"
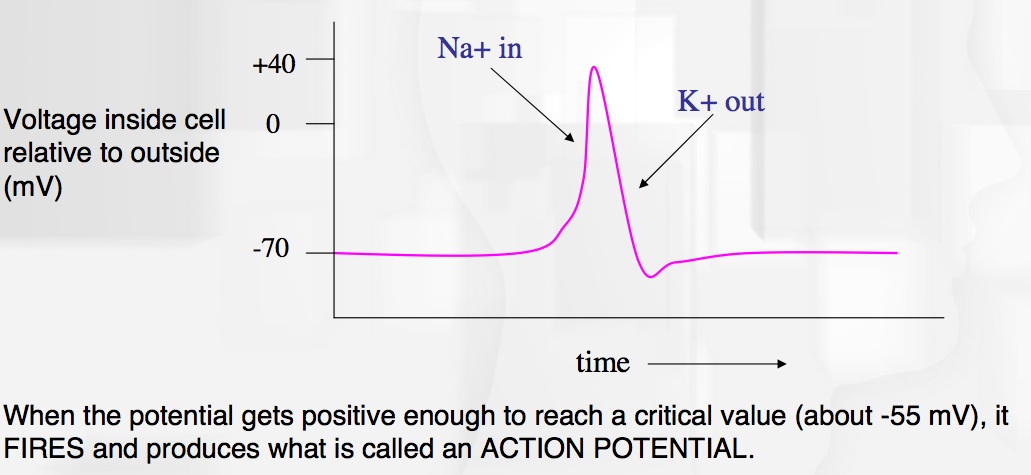
In a neuron this tipping point is called the threshold once the threshold is surpassed the neuron will create an action potential that travels down the axon, the neuron is said to"fire".
Notice how a signal propagates only after exceeding a threshold, and how the speed of propagation and signal amplitude is independent of the trigger signal amplitude.
By tipping the ruler so the signal propagates uphill you can increase the tilt of the first domino required to trigger an action potential.
By tipping the ruler so the signal propagates downhill you can decrease the tilt of the first domino required to trigger an action potential.
Tipping the ruler thus models the inhibitory and excitatory signals received by neurons at their synapses.
Once a neuron fires it requires time, called the refractory period before it can fire again. The refractory period averages 2 ms and prevents a neuron signal from reflecting back and travelling the wrong way down the neuron.
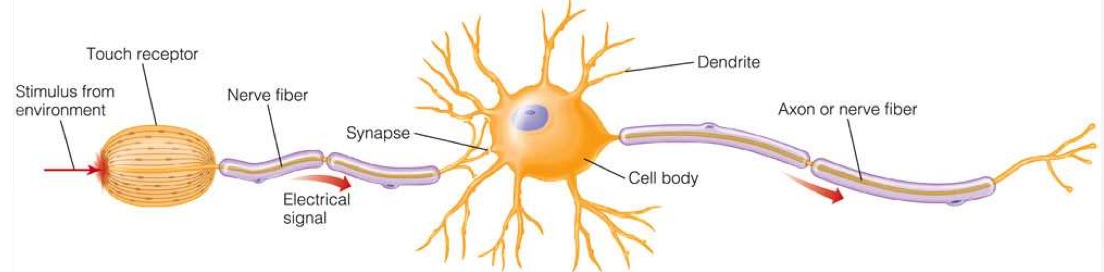
Here is drawing of a typical touch sensor neuron connecting via synapses to a second neuron which sends a signal down an axon toward other neurons.
Other versions of this activity:
Domino Model of a Nerve, Human Body Book
Also found in the book, The Brain Explorer
The speed of propagation of a neuron signal
The speed of propagation of a signal alomg a neuron varies depending on the diameter of the nueron.
You can get an estimate of the speed of neuron propagation by doing activities to measure reaction time.
You need a second person to help you measure your reaction time.
This can be done by having them drop a ruler and then measuring how far the ruler drops befre you catch it.
http://www.exo.net/~pauld/books/car_science/reactiontimer.html
Compare the time it takes to catch the ruler with your hands versus your feet.
You can also make a line of ten or more people have them hold hands and measure the time it takes a hand squeeze to propagate through all the people.
Measure the distance and the time to get an estimate of neuron propagation speed.
The speed of reaction depends on the neural processing required.
Card Sort Activity
This activity explores the relationship between motor response time and cognitive load using a deck of playing cards. It offers opportunity to explore data analysis and critique experimental design. The site includes teacher and student guides, teacher notes, and guiding questions for students.
http://brainu.org/card-sort-challenge
AMNH
Animal models of brains.
Project Implicit
This research applies the ideas relating cognitive load and motor response time we explored in the card sort activity to take a closer look at our implicit associations about race, gender, sexual orientation, and other topics. This activity requires sensitivity and significant maturity from the students.
Simple Version of Project Implicit using self-created playing cards
Social Card Sort Instructions
Social Card Sort (Cards)
At this page, you are able to select featured tasks OR a random social task will be selected for you.
https://implicit.harvard.edu/implicit/
If you would rather select which task you are assigned, try this link instead:
https://implicit.harvard.edu/implicit/selectatest.html
You can find an explanation of the test design and results here:
https://implicit.harvard.edu/implicit/demo/background/faqs.html#faq7
A direct connection to processing time can be seen in the activity "Shake My Colors" below.
It takes longer for the eye/brain to compare intensities that are subtly differet, the yellow versus the surrounding gray, than it does to process the larger intensity differences between the magenta and cyan and the surrounding gray.
Shake My Colors
Look at three colored dots on a white screen: magenta yellow and cyan. Shake the screen side to side and notice the yellow dot lag behind the magenta and cyan dots.
Brain Connection: Some perceptions take longer to perceive than others.
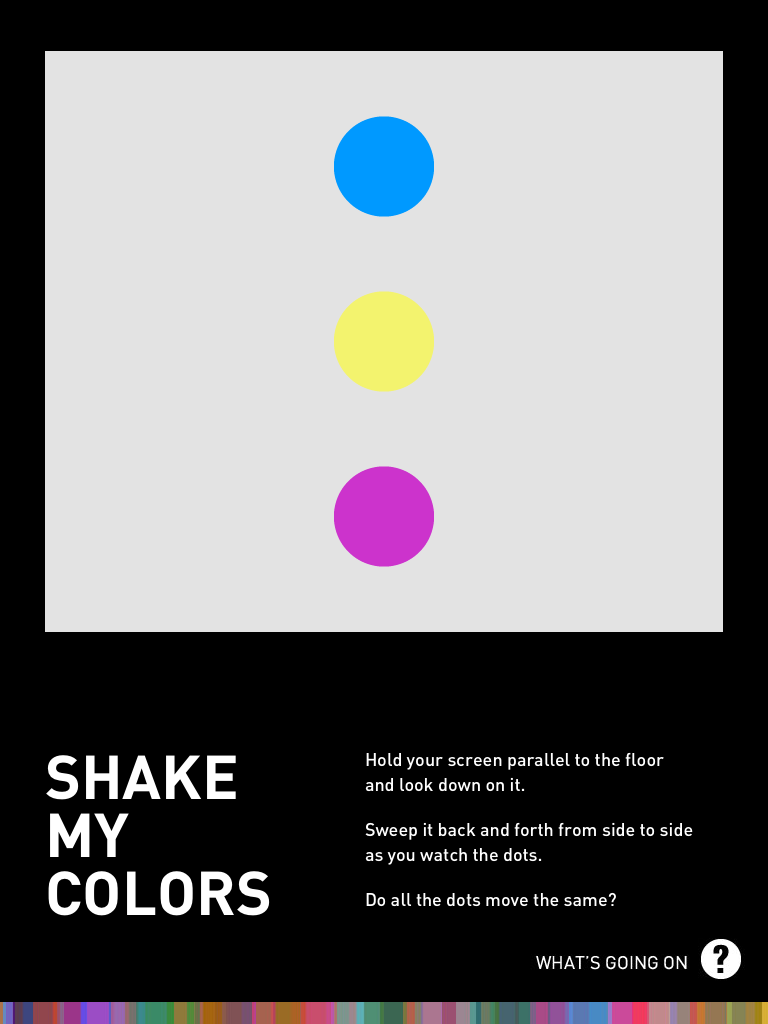
Shake the image right and left and notice that the yellow dot lags behind the magenta and cyan dots.
This illusion is available in the exploration "Shake My Colors" in the free ipad app Color Uncovered. Or just use this online image.
Notice that the yellow dot is closer in intensity to the white background than the darker magenta and cyan dots. It takes more time for the brain to perceive the subtle movement of color compared to the movement of different intensities. Thus the yellow dot which is said to be equiluminant when compared to the background, appears to lag behind the other dots.
See also the Pulfrich effect. which shows the time delay that occurs between stimulus and perception for a dim object versus a bright object.
Neurons adapt. When exposed to a stimulus continuously, neurons can reduce their sensitivity to that stimulus.
Some authors say the neurons get "tired" but it is better to say that they adapt.
A simple example of neurons adapting is shown by looking at a brightly colored circle while covering half the circle.
When Yellow is Yellower than Yellow
Stare for 30 seconds at the center of a bright yellow disk on a dark background, the left half of which is covered by white paper. Remove the paper and notice the yellow disk on the covered region glows more brightly than the uncovered half of the disk. Try covering it with other colored papers.
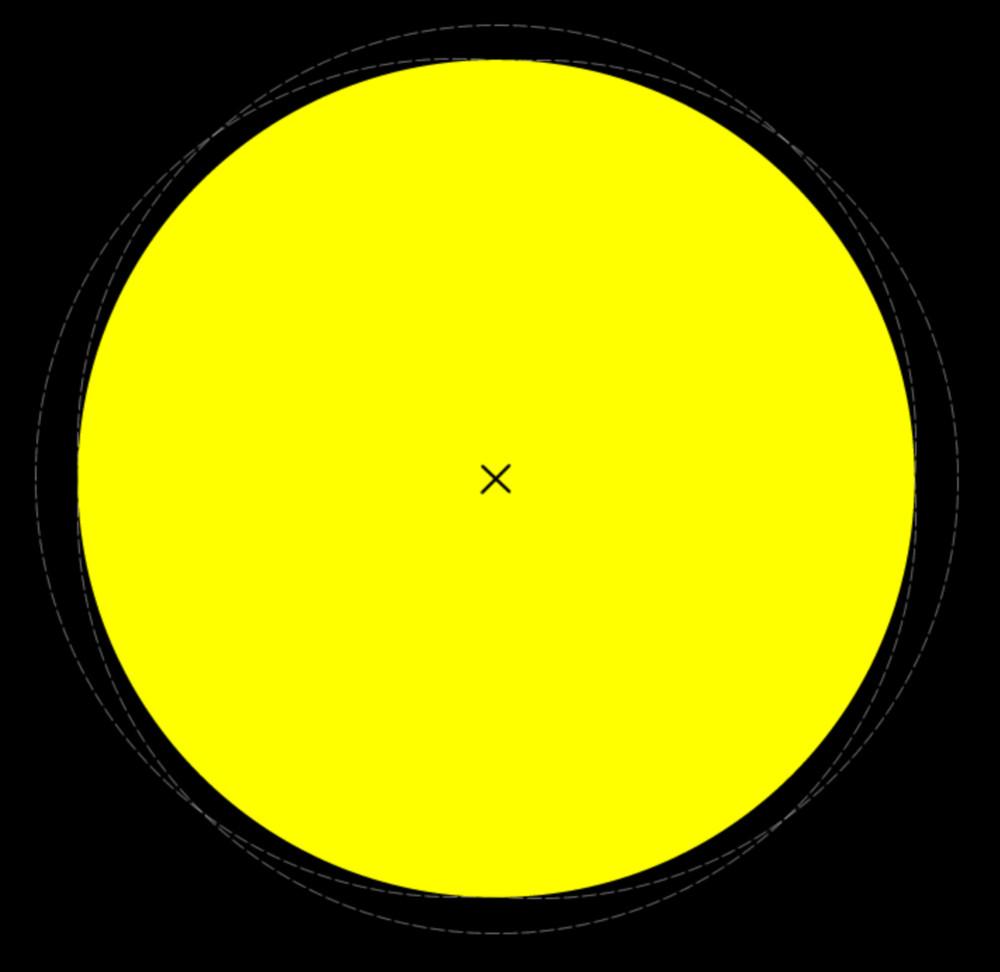
Cone cells in the retina, when they are exposed to intense light, adapt by decreasing their sensitivity. This means that cone cells exposed to bright yellow light decrease their sensitivity, so that when they observe yellow light they see it as dimmer than the same yellow seen by cone cells previously exposed to less intense yellow light. The adaptation of neuron firings based on previous firing rates is extremely important since it allows our perception to adjust to a wide range of conditions.
By the way yellow light is the perception of color created when both red and green sensitive cones fire. "Fire" a colloquial term describing when a neuron creates an action potential.
This illusion is available in the exploration "When Yellow is Yellower than Yellow" in the free ipad app Color Uncovered. Or just use this online yellow disk above.
A related exhibit is Fading Dot http://www.exploratorium.edu/exhibits/fading_dot/fading_dot.html in which the eye and brain adapt to a constant small gradient in color so that it vanishes from our perception.
Bird in the Cage
Stare at the center of the bird for 30 seconds. Then look in the cage. See a bird of a different color.
Brain Connection: Afterimage, neurons adapt to brightness by reducing the sensitivity of each color sensitive cone separately.

Bird In the Cage Online version
Bird In The Cage Snack version, how to build your own
When you look in the cage before staring at the bird it appears white. Red, green and blue cones in the retina are firing at rates which create a perception of white.
Stare at the eye of the red bird for 30 seconds then look in the cage. Notice the cyan bird.
The region of the retina upon which the red bird is imaged, has little green and little blue light, so the sensitivity of green and blue cones increases. The sensitivity of the brightly illuminated red cones decreases.
When you then look at a white surface inside the cage it then appears to have reduced red and increased green and blue, so you see a cyan bird.
Use the snack to see what would happen if you stare at a blue bird.
The bird appears even if after staring at the red bird you close your eyes and cover them so you see blackness. The glowing cyan bird still appears.
Another black and white version of Afterimage is available as a Snack http://www.exploratorium.edu/snacks/afterimage/index.html
For a more subtle version of this illusion see, "Colorize this photo with your eyes", in the free ipad app Color Uncovered.
Neurons can also alter the sensitivity of adjacent neurons.
Gray Step
Observe a gray rectangle with a cord in the middle, remove the cord and "see" two different gray areas. These two gray areas are identical.
Brain Connection: Neurons influence the sensitivity of adjacent neurons, aka lateral inhibition.
Gray Step This Snack includes download-able versions which can be printed on high quality printers.
Learn how the eye and brain emphasize change, for example edges.
There are 120 million rods and 6 million cone cells in each eye. There are1 million neurons in the optic nerve.
In simple terms before the image on a retina is sent to the visual cortex for processing it must be preprocessed by the retina.
Only 1% of the signal detected by the retina is passed to the visual cortex to construct a perception of the world.
Evolution has selected the 1% to maximize survival.
Gradual changes in intensity of light, are not sent along the optic nerve, however edges where brightness changes are sent.
The information obtained from the edge is then applied to the regions adjacent to the edge. Thus in the image above when the edge is blocked both regions look the same.
When the edge is revealed there are two regions each with a different shade of gray.
But this is still an illusion!
Each region is identical to the other. There is a gradual change in intensity of light scattered by the exhibit going from darkest on the left to brightest on the right.
Edges are emphasized because neurons influence adjacent neurons in the retina. A cone in bright light sends electrical pulses called the "activation potential" more often than one in dim light. Colloquially we say the neuron "fires." However, a cone in bright light that is firing more often turns down the sensitivity of an adjacent cone. If that adjacent cone is in dimmer light it will fire even less often due to the reduction in sensitivity created by its neighboring cone.
The reverse is also true. A slowly firing cone increases the sensitivity of adjacent cones. So the cone cell in dim light increases the sensitivity of adjacent cones. These cones then fire even more rapidly. Leading to a perception of enhanced brightness.
These effects are known as lateral inhibition and it enhances differences between adjacent neurons.
These are examples of excitation and inhibition of adjacent neurons.
To a mathematician this coupling of adjacent cone cells is similar to taking a second derivative of intensity versus distance. Mathematical interpretation of gray step.
Hermann Grid
Dots appear in the intersections of this grid.
Brain Connection: Sensory neurons are grouped into center excitatory, surround inhibitory bundles on the retina,
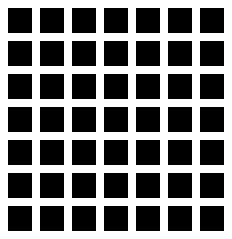
The explanation for the Hermann grid follows from the center-surround model of retinal sensors. Cones in the fovea are connected to neighboring cones. When enough light hits this cone it fires. When a cone in a circle of cones surrounding the center cone fires, it reduces the sensitivity of the center cone, it requires more light to fire. A cone in the middle of two intersecting light lines, like the one in the top left of the diagram below has its sensitivity reduced by the cones in the 4 light regions around it. A cone like the one on the bottom left ha only two light regions around it so its sensitivity is reduced by a lesser amount. Thus a dark smudge appears where the white lines cross.
However, you may notice that when you actually look at a crossing point the dark smudge disappears. This is because only in the fovea are single cones connected. Outside the fovea rods and cones are connected in much larger bundles. This is illustrated by the center-surround regions shown on the right side. Where the small center-surround region of the fovea fits entirely withing the white lines of the array. So the size at which the Hermann Grid is printed matters.
Neurons also adapt to change by adding or removing connections to other neurons.
Altered Reality Activity
There are several write-ups out there for the altered reality goggle activity, including the Exploratorium’s “Hoop Nightmares.” This particular guide from the University of Minnesota’s BrainU focuses on neural plasticity as the central theme. The site includes teacher and student guides, notes for the teacher, and possible extensions. And check out the rest of their site for some great inquiry-based neuroscience activities for middle and high school.
http://brainu.org/altered-reality
Making the Goggles
In today’s activity, we used 3M press-on Fresnel lenses with a 30 degree diopter. The price of these have increased significantly over the past few years. (Are you sitting? $19 per lens. That means $38 per pair!) Not doable for most. You might consider pooling resources to make a set and share them. You will need to order by phone. Information can be found here:
http://www.fresnel-prism.com/products/-3m-press-on-optics/
OR
Use plastic prisms. RAFT usually has them pretty cheap. Check out the Exploratorium’s “Hoop Nightmares” exhibit on the floor, or the snack version for instructions on how to make the goggles using prisms.
OR
You can use magnifying sheets that are sold at stationary stores and do some creative cutting (see description in the handout linked above). Because these are curves, the effect is a bit off, but they work fairly well. Make sure that you purchase the thin plastic sheets rather than the thick ones so that they can be cut.
Resources
Exploratorium
website http://www.exploratorium.edu
Exhibits
Exhibit Services Catalog
http://exs.exploratorium.edu/exhibits/
Disagreeing about Color 20 people look at a circle of colors surrounding a central color and disagree on which color in the circle matches the one in the center. This is because their cones contain different mutations for the rhodopsin. This is known as color anomaly, and is a weak version of color blindness.
Disappearer, stare at the middle of a rotating wood grain disk , small objects suspended over the moving disk disappear because the brain emphasizes perception of motion.
How the brain organizes image perception (a video of the visitor is shown as colors, edges, moving edges and faces illustrating how the brain takes apart an image.)
Hoop nightmares http://exs.exploratorium.edu/exhibits/hoop-nightmares/ (Brain plasticity, wear goggles that deflect the visitors vision 30 degrees to one side and have them learn to shoot baskets.)
Snacks
The Exploratorium Science Snackbook http://www.exploratorium.edu/snacks/
Simple versions of Exploratorium exhibits which can be built for under $10
Benhams Disk how a black and white rotating pattern can produce the sensation of color http://www.exploratorium.edu/snacks/benhams_disk/index.html
Blind Spot http://www.exploratorium.edu/snacks/blind_spot/index.html
Cold Metal a touch illusion http://www.exploratorium.edu/snacks/cold_metal/index.html
Depth Spinner http://www.exploratorium.edu/snacks/cold_metal/index.html
Far Out Corners http://www.exploratorium.edu/snacks/far_out_corners/index.html
Gray Step http://www.exploratorium.edu/snacks/gray_step/index.html
Peripheral Vision http://www.exploratorium.edu/snacks/peripheral_vision/index.html
Seeing Your Retina http://www.exploratorium.edu/snacks/seeing_retina/index.html
Your Sense of Taste http://www.exploratorium.edu/snacks/your_sense_of_taste/index.html
Exploratorium Online interactive resources
Squirming Palm A rotating patterns causes aftereffects http://www.exploratorium.edu/exhibits/squirming_palm/index.html
Online interactive illusions http://www.exploratorium.edu/exhibits/changingill/
Cafe Wall Illusion http://www.exploratorium.edu/exhibits/cafe_wall/cafe.html
Sliding Gray Step http://www.exploratorium.edu/exhibits/gray_step/
Stroop Test (multilingual) colors versus color words http://www.exo.net/~pauld/activities/perception/stroopeffect/stroop.htm
McGurk Effect (also available as a snack version with 2 participants and a viewer.)
Apps
Sound Uncovered
Find the highest note, a sheppard tone series acoustic illusion.
McGurk Effect, sound versus sight
It Takes two, how two ears combine sounds.
Color Uncovered
Shake My Colors, equiluminant time delay.
See the Blue Square, It's not there
Fade to Green, unchanging blue smear disappears over time.
When is Yellow Yellower than Yellow, adaptation of sensory neurons
Colorize this photo with your eyes, a type of afterimage.
Exhibitions
Memory
Lectures on Memory
Sheep Brain Dissection
Cows Eye Dissection
Anatomy of a Memory 9 minute video of a human brain dissection
Webcasts
Compilation of webcasts on the brain
FMRI Look at a working brain
External Resources
Project LITE: Prof Kenneth Brecher
Eye and Brain: Richard Gregory
Seeing the Light: Falk, Brill,Stork
Eric Chudler Neuroscience for kids
Neurons and perception http://courses.washington.edu/psy333/lecture_pdfs an excellent collection of illustrations