Create a contour map of a mathematical function
Material
Graphing Calculator (available from Pacific Tech
http://www.pacifict.com/Products.html
for $60 for teachers and $40 for students.)
Many other mathematical programs will produce contour maps of
functions.
Assembly
Enter the equation for the function for which you wish to create a contour map.
for example z = r^2
Simple technique
Under the graph menu choose contour plot. graph>contour plot.
Use the controls at the bottom to control the scale of the plot and the spacing of the contours.
Experiment until you get the pattern you like.
Advanced technique
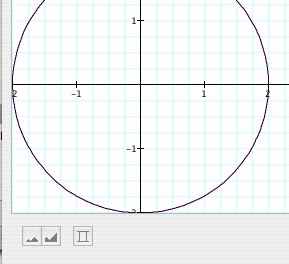
You can enter the exact values of the contours you like by typing the equation followed by a comma and z
z = r^2, z
Then press the option key and = at the same time to get the "is an element of the set" symbol. Then type the values of z for which you would like the function plotted between brackets.
![]()
The program will plot the contour lines.
You can scale these contours up and down in size using a graphics editing program or a copier that can enlarge or reduce images.
You can also plot contour maps of functions with the more expensive programs:
Maple, Contour Plots in maple, another example
Matlab: Contour Plots in Matlab
Mathematica Contour Plots in mathematica
Free Applets
|
Scientific Explorations with Paul Doherty |
|
11 November 2007 |