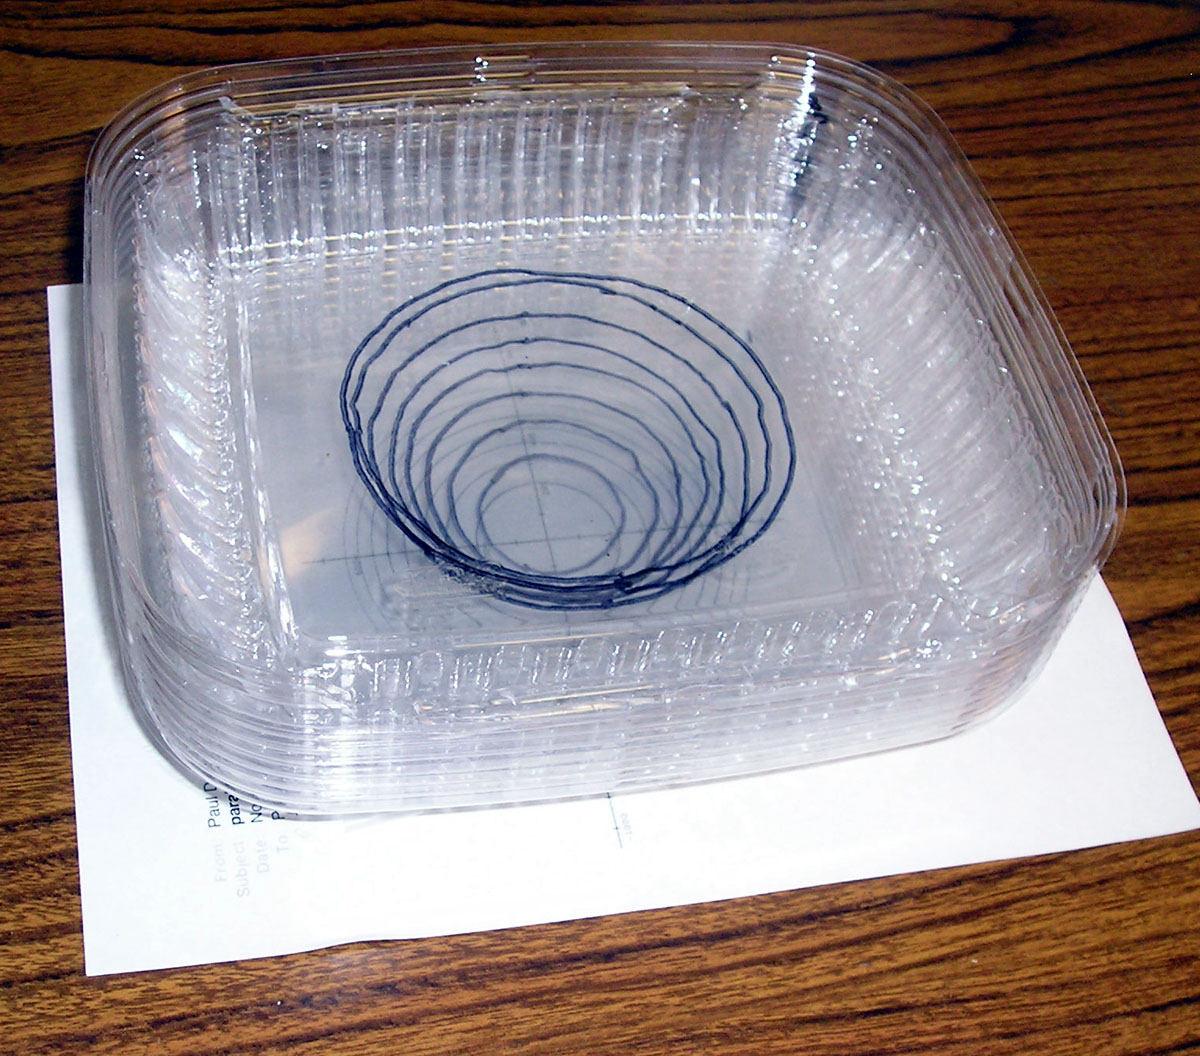
The finished 3 dimensional plot of the contour lines of the paraboloid.
Deli Tray Math
A Deli-ightful introduction to higher dimensions
Introduction
Transparent trays used in delis to serve salads stack together in transparent layers which can be used to show contour maps of mathematical functions, and much more.
Material
9 hinged transparent deli containers,(such as DART
C90HT, or Reynolds 1757 available from Restaurant supply stores in
bulk at $0.12 to $0.25 each see note at bottom.)
scissors
tape or double sided tape
Sharpie, or other marker to write on plastic.
Contour maps of mathematical functions (Created by various programs
like Graphing Calculator)
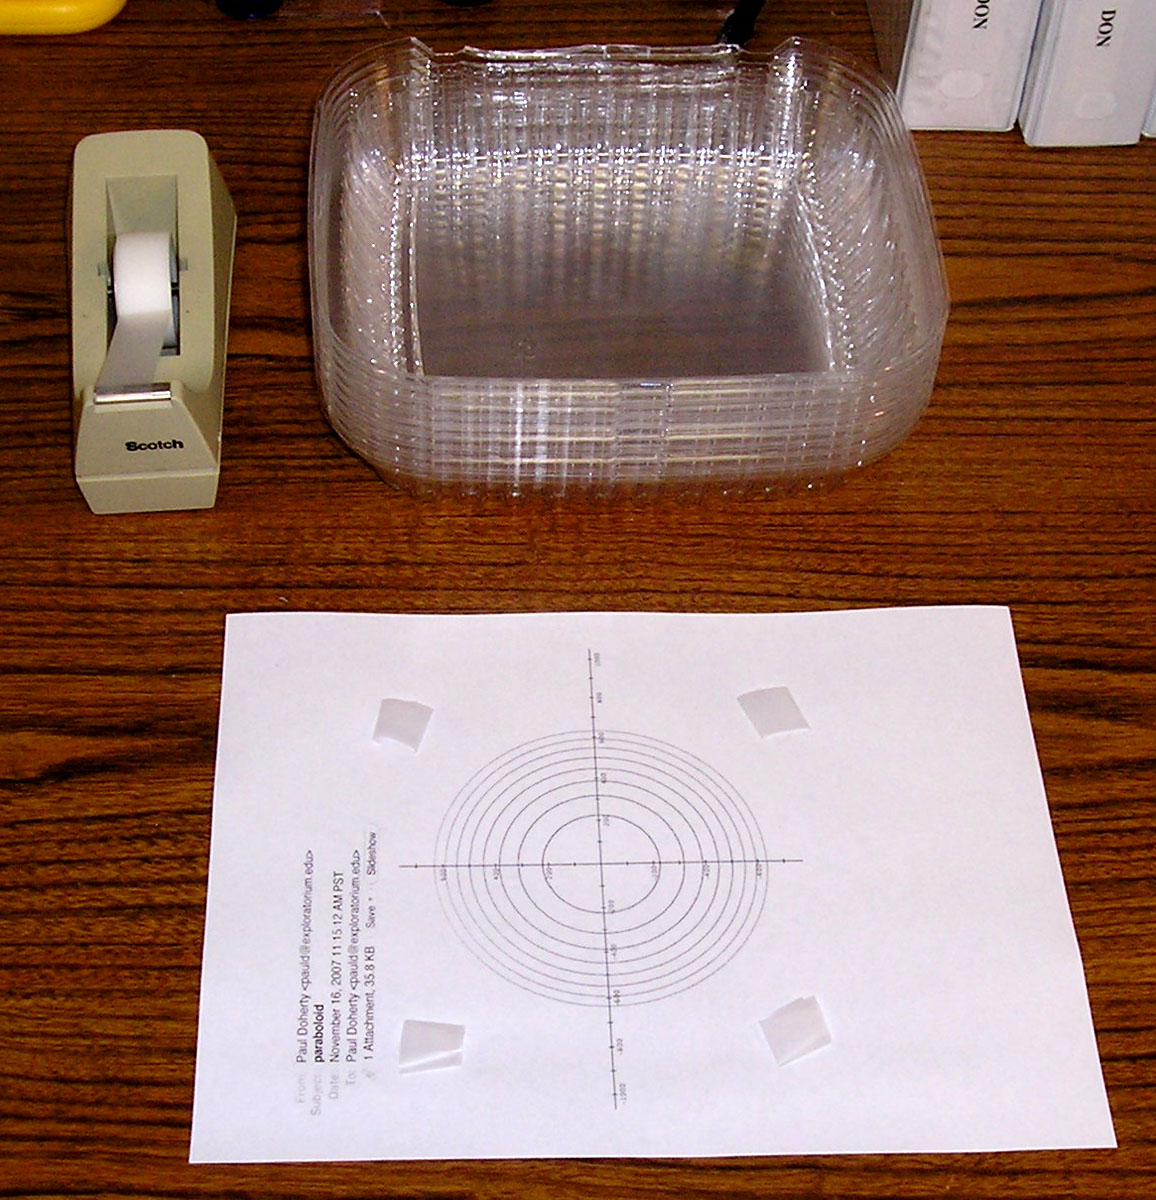
Deli trays which have been cut in half, tape and a contour map of a function are what you need to start.
Assembly
Cut the bottoms and tops of the deli containers apart. Set aside the tops of the containers they can be used as well but you should always use tops with tops and bottoms with bottoms.
Use a mathematical plotting program to draw the contour map of a mathematical function.
For example a paraboloid z = r^2 or z = x^2 + y^2

The contour map of a paraboloid.
Print the contour map out so that the largest contour will fit inside the flat bottom of a deli container. Include 8 contours equally spaced in the z axis on the plot.
Tape the paper copy of the contour map to the bottom of one deli container using 4 loops of tape, one loop at each corner of the deli tray(or double sided sticky tape) the tape will keep the contour lines in position with respect to the deli tray. (Recently we have found it is better to tape the pattern to the inside of the deli container after trimming it to size.)
This deli tray will serve to position all the subsequent deli trays.
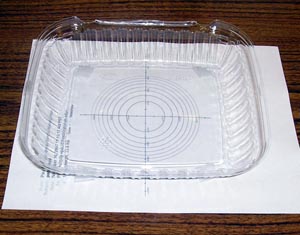
Drop an empty deli tray into the deli tray that has been taped to the paper master.
Use a sharpie to trace the lowest contour line onto this deli tray.
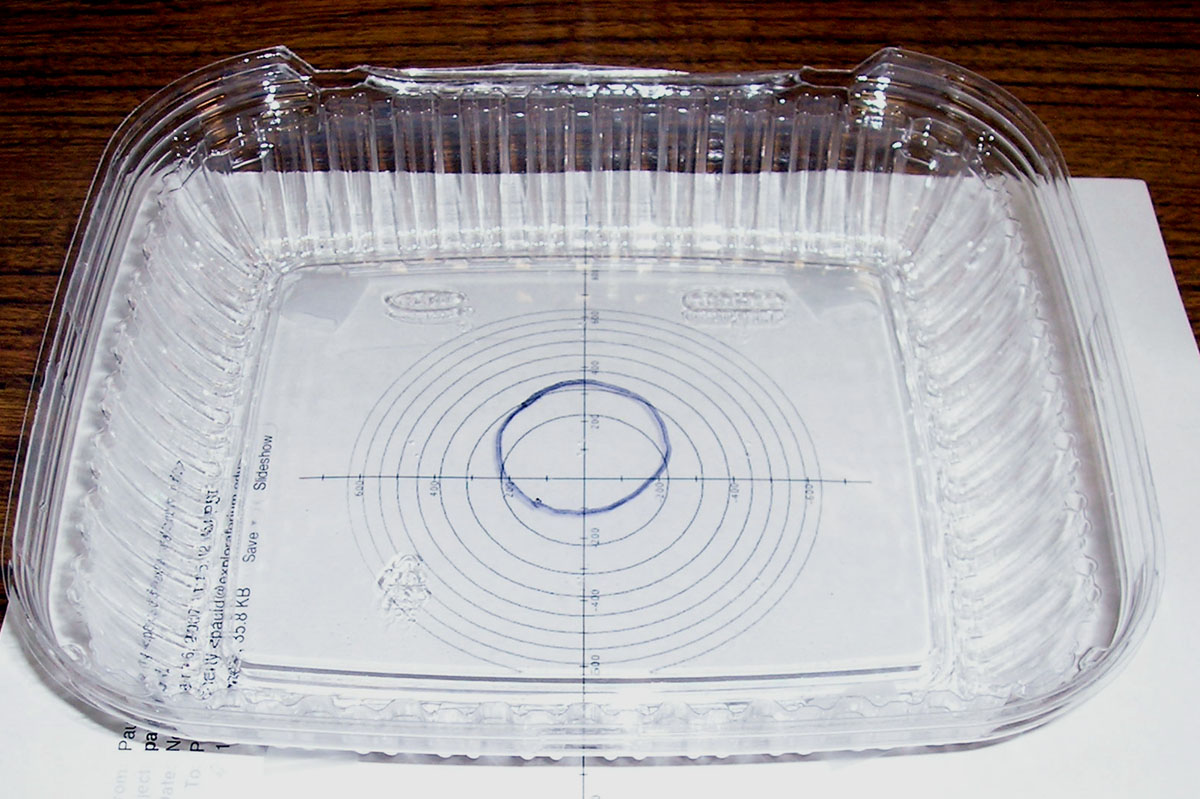
(To erase mistakes use rubbing alcohol and a q-tip)
Label this deli tray #1 and set it aside.
Place another deli tray into the deli tray that has been taped to the paper master.
Use a sharpie to trace the next lowest contour line onto this deli tray.
Label this deli tray #2 and place it inside deli tray #1.
Repeat for all 8 contour lines.
To Do and Notice
Keeping the stack of 8 trays together look at the contour lines of the function in three dimensions.
Remove the trays from the locator tray and the contour map.
Turn it over and look at the bottom.
Notice you have made a three dimensional map of a function.
Note
When you cut apart 9 hinged trays you will get two sets of 9 trays for this activity.
Bulk orders for 200 or more trays can be purchased from http://www.instawares.com.
|
Scientific Explorations with Paul Doherty |
|
11 November 2007 |