Atmospheric Carbon Dioxide
The Keeling Curve
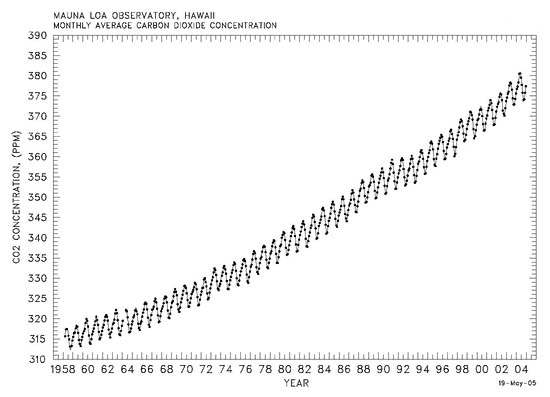
Since 1958 precise measurements of CO2 in the atmosphere have been made on Mauna Loa Volcano in Hawaii.
Notice the yearly cycle as spring in the northern hemisphere promotes plant growth which depletes the CO2.
Notice also the long term trend. CO2 concentration rises by about 5 ppm per year.
(Note Dr. Charles Keeling passed away in 2005.)
In 1800 the value of CO2 was thought to be below 280 ppm.
Wait a minute! How do we know that?
The record of carbon dioxide and temperature
Gasses trapped in glacial ice cores preserve ancient CO2 concentrations in the atmosphere.
The Russians drilled a deep ice core near their Vostok Station in Antarctica it showed a close correlation between temperature change and CO2 concentration over the past 420,000 years. Notice how temperature tracks CO2 concentration.
Look at this graph of temperature and CO2 concentration recorded in the antarctic ice over the past 420,000 years.
What do you see?
If you looked at the graph up to 10,000 years ago what would you predict would happen to temperature and CO2 concentration in the atmosphere? Compare your prediction to the actual result.
From this graph we know that the concentration of CO2 in our atmosphere has not been exceeded in the past 420,000 years and likely not for the past 20 million years (from NOAA). Predictions of CO2 concentration in the year 2199 range from 490 to 1260 ppm.
|
Scientific Explorations with Paul Doherty |
|
22 April 2006 |