It comes from Hubble telescope images of distant supernovae.
On January 18 at the Exploratorium I presented the following explorations to the staff.
Cepheid Variables and the big bang
In 1912 Henrietta Leavitt, an astronomer from Harvard University noticed that the brightness of Cepheid variable stars was linearly proportional to the period of oscillation. To do this , she observed several hundred Cepheids in the Magellanic Clouds.
A well known Cepheid is Polaris, the pole star, it has a period of 4 days. Other Cepheids oscillate with a period between 1 and 50 days. They brighten quickly and dim slowly. At their brightest they can be over twice as bright as when dim. The average Cepheid is 10,000 times brighter than the sun. Larger, brighter Cepheids take longer to oscillate, just like a larger bell has a lower resonant frequency than a smaller one.
In 1916 Vesto Slipher and Francis Pease examined the spectra of galaxies and noticed that some were red shifted. Later Harlow Shapley noticed that most were red shifted and so, due to the Doppler effect, were receding from us.
In 1920 Edwin Hubble used the 100 inch (2.5 m) telescope on Mt. Wilson to show that the Andromeda nebula is actually outside of our galaxy. He was able to resolve stars in the nebula and to find its distance using Cepheid variables. (We now know that the distance to the Andromeda galaxy is over 2.5 million light years.)
To get an idea of the size of the universe try mapping the universe onto a city.
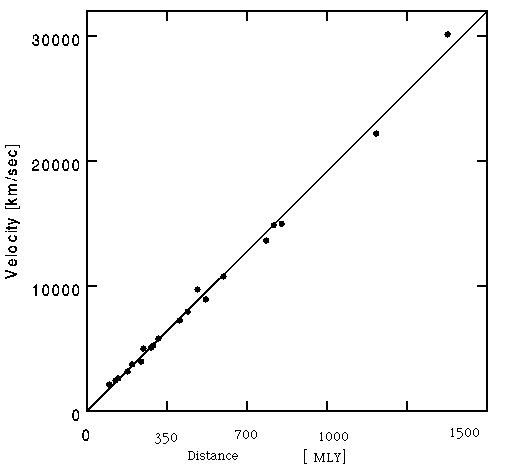
In 1929 Edwin Hubble plotted the red shift, z, of versus the distance to galaxies, R, and found that redshift versus distance fell on a straight line. The red shift z is the ratio of the change in wavelength of a spectral line dL to the original wavelength L, z = dL/L. The red shift can be converted into velocity and so today we can plot the velocity of distant galaxies versus their distance.
This is one of the most amazing discoveries of the 20'th century. All galaxies in the universe (beyond our neighbors like Andromeda) are moving away from us. The velocity of their recession is proportional to their distance.
This one graph spelled the death of the theory that the universe was static and unchanging, it showed that the universe was expanding.
Einstein had published his theory of general relativity in 1916. When it was solved for the universe it showed that the universe was either expanding or collapsing. At that time, astronomers believed that the universe was static. So, Einstein introduced a term into his equations called the cosmological constant. This term made the universe static. Hubble's graph showed that the universe was expanding. Einstein dropped his term and called it "his greatest blunder."
Yet, in 1998, observations indicate that the general relativistic equation for the universe may require the very cosmological constant that Einstein repudiated.So his greatest error may have been calling his cosmological constant his greatest error.
The Big Bang
If you look at the above plot and ask what the past history of the universe you find an interesting thing, all of the galaxies were together at the same place about 20 billion years ago. (The near ones cover their short distance at a slow speed, the far ones cover a longer distance at higher speed.) You'll also notice that we are at the center of the universe.
This observation is the, so called, big bang model
of the Universe
Which says that the Universe started from a hot dense beginning and
has been expanding ever since
(The big bang name was coined by an opponent to the model Fred Hoyle, who used the derogatory name to belittle the theory.)
It is a little more complicated than that, the gravitational attraction of everything in the universe on everything else has been slowing down the expansion, so that in the past galaxies were moving away from each other more quickly. This means that the universe is younger. The best estimate for the age of the universe in 2001 is 14 billion plus or minus 2 billion years. (Where a billion is 109 years in standard American usage)
A two dimensional model of space-time
The three dimensions of space are expanding in time. This is very hard to picture so let's use a balloon instead. Pretend we are flat creatures, called flants, that live in a two dimensional space. The flants cannot conceive of a third dimension. Yet the flants live on a balloon that exists in 3 dimensions. We humans live in three dimensions yet it is difficult for us to picture a four dimensional space-time.
Here is an experiment using dots stuck to a balloon to model the universe of the flants.
Looking out in space is looking back in time.
Imagine how a street would look if light took ten years to travel each block.
Light left the big bang and has been traveling toward us ever since.
Light from the Big Bang was seen in Holmdel New Jersey in 1968.
Arno Penzias and Bob Wilson were using a microwave antenna in a telecommunications experiment. They noticed a noise in their system. The noise came from radio waves sent out by the big bang. The radio waves had been traveling through space and time for 14 billion years.
The big bang started out very hot and very dense. It has been expanding and cooling ever since. 300,000 years after the big bang (one source says 500,000 years) the Universe cooled to 4000 kelvins. This is a very important temperature. Hydrogen atoms hotter than 4000 K collide with enough energy to ionize each other creating an opaque plasma. Below 4000 K the hydrogen can exist as neutral atoms a transparent gas. So, at the time when the plasma went away, the universe became clear, and the last photons emitted by the plasma could travel through space and time to reach us today.
The light emitted by a 4000 K plasma is orange. And yet when we look out into the vacuum of space between the stars we do not see orange light. As the orange light was traveling through the vacuum of space, the space itself was expanding and the wavelength of the light was stretching.
Since the time when the light was emitted, 300,000 years after the big bang, to now, 14 billion years later, the universe has expanded 1300 times in size, so the wavelength has stretched 1300 times. This stretches the wavelength of the orange light until it is in the microwave part of the electromagnetic spectrum. Human eyes cannot see microwaves, thus the sky looks black.
To explore how this happens, draw a light wave on a rubber band then stretch the rubber band.
Finding the Center of the Universe
Since everything is expanding away from us, it
appears that we are at the center of the Universe.
However, every point in the Universe sees itself as the center! To
see this do the following exploration.
The Center of the Expanding Universe
In this exploration, we use two transparencies full of random dots representing galactic clusters . One represents the galactic clusters as they are now, the other represents the galactic clusters as they were over a billion years ago when the scale of the universe was 5% smaller. Line up two galaxy images one over the other and that galaxy will appear to be the center of the expansion.
A simpler model
The flants living on their balloon have a hard time visualizing how their two dimensional world is expanding in time into a three dimensional space. So they create a simpler model. They imagine one dimensional creatures who live on a line. The line is curved into a circle. In this universe there is one creature and one star. Light takes time to travel from the star to the creature. So the creature sees the star as it was in the past.
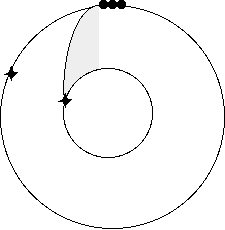
The arc connecting the flant to the star is the path light follows through spacetime.
Looking in the other direction, and there is only one other direction, there is nothing in the way and so the creature looks out in space and back in time and sees the big bang itself. At the big bang the circle begins as a very tiny circle. After 300,000 years it is a larger circle after 14 billion years it is a very large circle. Light travels from a point of the 300,000 year circle to the 14 billion year circle through space and time.
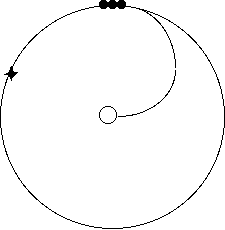
The flants now understand their balloon. If one of them looks out in space they either see a dot in the past when the balloon was smaller or they see the light coming from the big bang itself. When they and all the dots were at the center of space and time.
We look out into space and see the universe in the past. the farther we look out the older the universe we see. Look out far enough and we can see the big bang itself. Well actually a time 300,000 years after the big bang when the universe became transparent.
Looking at the Big bang
Since we can see the big bang, scientists study it.
The radiation from the big bang has the spectrum of a black body. Here is some of the most recent data:
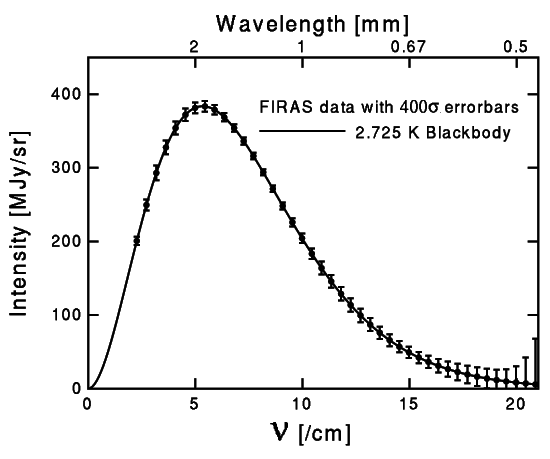
The blackbody spectrum of the big bang arriving at earth now.
FIRAS is the name of the instrument.
Notice that the error bars shown are 400 sigma! the usual 1 sigma error bars would be far too small to see.
The unit of intensity is megajanskys per steradian where jansky is a unit of cosmic radio intensity. The frequency is in inverse cm.
The current best value for the temperature of the
blackbody radiation from the big bang is 2.728 +- 0.004 K .
The light from the big bang is almost all at this same temperature,
there are however small deviations across the sky.
If we emphasize the differences in temperature in the big bang and plot the entire sky as an ellipse then here is an image of the temperature changes seen in the big bang across the entire sky, red is cooler and blue is hotter.
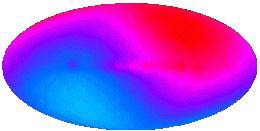
This pattern is due to the Doppler shift of the big bang radiation because of the motion of the earth through the universe. That's a big idea. We are moving through the universe away from the big bang on one side and toward it on the other.
The earth orbits the sun, the sun orbits the Milky way, The Milky way moves about within the local galactic cluster and the Galactic cluster is being pulled across space by the gravity of the "great attractor." The great attractor is a huge supercluster of galaxies. Add together all of these motions and we are moving 600 km/s toward the great attractor. This results in the blue region of the above image.
The redshift of distant galaxies is due to expansion of the universe not to the Doppler shift.When Hubble first discovered the expansion of the universe he explained the red shift of the light from distant galaxies as a Doppler shift produced by their motion. Today astronomers say that the redshift is not due to the Doppler shift it is due to the expansion of space itself.
The above image shows one reason for the switch. It shows that the Milky Way galaxy is moving through space with respect to the big bang at 600 km/s producing a redshift behind us and a blueshift in front. Imagine leaving the Milky Way and heading in the opposite direction at 600 km/s the big bang would no longer show a pattern of redshift/blueshift. We would be at rest with respect to the big bang. Now imagine a distant galaxy an observer in that galaxy looks around and sees that there is no redshift/blueshift of the radiation from the big bang. They are at rest as well. Yet, when each of these galaxies which is at est with respect to the frame of reference of the big bang look at each other they see a redshift! This redshift is the cosmological redshift. It occurs because while a photon is in transit from one galaxy to another it moves through space which is expanding. If the galaxies were moving with respect to the big bang then they would show a Doppler shift in addition to this cosmological redshift.
Now we can understand why scientists have switched from explaining the redshift of galaxies as a Doppler shift due to their velocities and
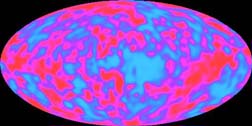
If we remove this pattern from the big bang radiation and keep turning up the gain on our image we eventually see patterns of hotter and colder regions in the big bang radiation. The blue regions are only tens of millionths of a degree hotter than average. And yet they these slight temperature fluctuations are extremely important. The fluctuations lead directly to the formation of the galaxy clusters that populate the universe today.
The Hubble Telescope
The Hubble Telescope can resolve Cephieds 10 times further away that the earth based telescopes of the 1990s. This allowed Cepheids to be observed in over a dozen nearby galaxies, including those in the Virgo cluster.
The infrared detector aboard Hubbell, NICMOS, allows better observation of Cepheids because dust effects the brightness of Cepheids less in the infrared. (Many photographers know this and use infrared film to penetrate haze.)
Hubble is also used to measure the light curves of type 1a supernovas. these are extremely bright and can be seen at great distances. Type 1 supernovas explode with a constant brightness. If you know the intrinsic brightness of an object and its measured brightness on earth, you can find the distance to that object using the inverse square law. The Exploratorium has an exhibit on the inverse square law. Here are two hands-on explorations of the inverse square law.
Simple Inverse Square Find how the intensity of a light changes when you increase the distance to the light.
Solar Brightness Compare the intensity of sunlight to the intensity of a lightbulb.
polaris is a cepheid, 3.97 day period, 0.15 magnitude.
|
Scientific Explorations with Paul Doherty |
|
15 Jan 2001 |