Global Climate Change Workshop
This workshop is based on information presented in the Global Climate Change website of the Exploratorium.
Global Climate Change, http://www.exploratorium.edu/climate/
Many factors contribute to changes in global climate:
Changes in the earth itself: in the atmosphere, the hydrosphere, and the cryosphere
Changes in the earth's orbit known as Milankovic Cycles.
Changes in the energy output of the sun, often called the solar "constant"
Introductory activities: Using liquid crystal thermal postcards to
explore conduction convection and radiation.
Conduction, convection and radiation.
Changes in the Earth Itself
Atmosphere
In 1958 Dr. Charles Keeling began measuring the carbon dioxide concentration in the earth's atmosphere. He was surprised to find out that not only did the concentration of CO2 fluctuate on an annual basis that it was also steadily increasing. It is shocking to think that something as massive as the earth's atmosphere could change in 1 year! In fact each year the amount of CO2 in the atmosphere fluctuated by 3%. This is important because CO2 is a greenhouse gas.
See the exploration of the Keeling Curve
Glacial ice preserves a record of the concentration of carbon dioxide in the atmosphere it also preserves a record of the temperature. See Glacial Record
From this glacial record we know that in 1800 the atmospheric concentration of CO2 was below 280 ppm (parts per million, or 0.028%) The concentration now is near 380 ppm and increasing 5 ppm per year.
The Vostok ice core reveals that the current level of CO2 in the atmosphere is greater than at any time in the last 420,000 years, and it is still rising.
Basic explorations:
Meet CO2 Smell CO2 in a box containing dry ice or over soda water.
Measure CO2 in water by measuring the Ph of the water. Dissolved CO2 creates carbonic acid in the water which lowers the Ph.
The
power of the sun, Using a thermal postcard
to compare the energy emitted by the sun to the known energy emitted
by a 200 watt light bulb.
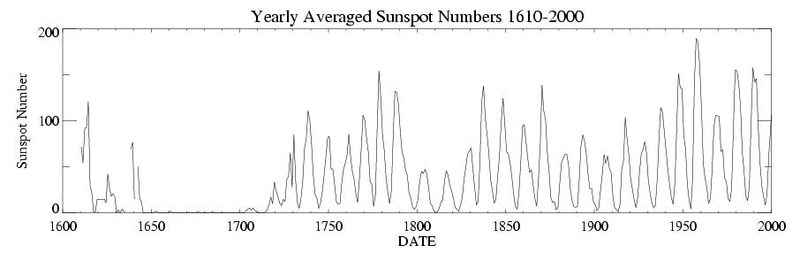
We have only been using satellites to accurately measure the amount of energy radiated by the sun for the last 20 years, so we have no information on the long term trends. The sun goes through an 11 year and also a 22 year sunspot cycle which is known to influence solar output.
The sunspot cycle, note the lack of sunspots between 1650 and 1700, the Maunder minimum. The Maunder minimum corresponded to the coldest part of the "Little Ice Age" although we don't have a causal connection between the two.
The output of the sun over the past 20 years.
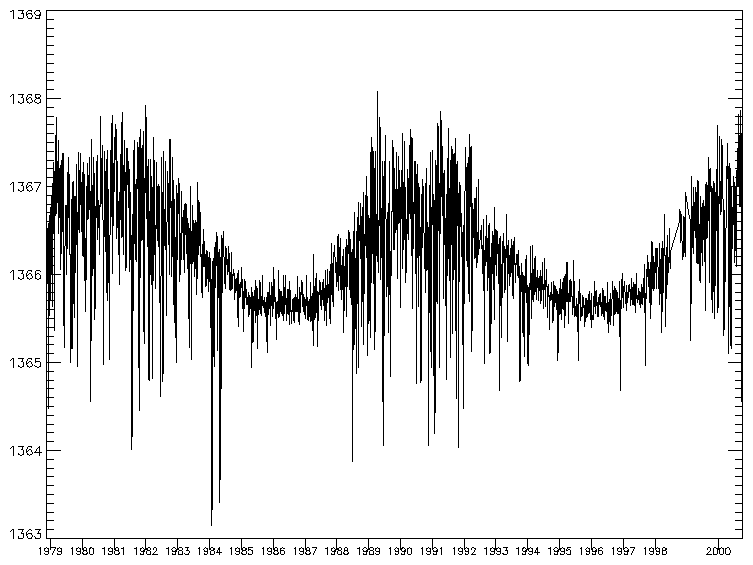
You can see the sunspot cycle in the data.
Milankovic Cycles,
The earth's orbit undergoes cyclic changes in its eccentricity, while the inclination of the earth's axis of rotation is also changing, the orientation of the earth's axial tilt also changes due to precession. The three time scales for these changes affect the climate of the earth and trigger ice ages, when the continents are appropriately placed on the surface of the earth.
Cycles in the earth orbit from 200 thousand years in the past to 100 thousand years in the future.
These cycles can be used to explain ice ages.
The Rectified Globe, If you place an earth globe outdoors in the sun with the polar axis pointing north and your location at the top dead center then the sunlight on the globe will be the same as the sunlight on the real earth. After 5 minutes exposure to the sun you can feel which portions of the earth are hotter and which are cooler.
The NCDC says "In addition to changes in energy from the sun itself, the Earth's position and orientation relative to the sun (our orbit) also varies slightly, thereby bringing us closer and further away from the sun in predictable cycles (called Milankovitch cycles). Variations in these cycles are believed to be the cause of Earth's ice-ages (glacials). Particularly important for the development of glacials is the radiation receipt at high northern latitudes. Diminishing radiation at these latitudes during the summer months would have enabled winter snow and ice cover to persist throughout the year, eventually leading to a permanent snow- or icepack. While Milankovitch cycles have tremendous value as a theory to explain ice-ages and long-term changes in the climate, they are unlikely to have very much impact on the decade-century timescale. "
The actual measured change in the global average temperature
Global surface temperatures have increased about 0.6°C (plus or minus 0.2°C) since the late-19th century, and about 0.4°C (+- 0.25°C) over the past 25 years (the period with the most credible data) (from the NCDC report)
The National Climate Data Center says "Human activity has been increasing the concentration of greenhouse gases in the atmosphere (mostly carbon dioxide from combustion of coal, oil, and gas; plus a few other trace gases). There is no scientific debate on this point."
The IPCC (intergovernmental Panel on Climate Change) predicts an increase in temperature of between 1.4 and 5.8 °ç over the next 100 years.

Measured temperature changes over the last century. Click to enlarge.
Paleo climate data (from tree rings etc.) over the last 1000 years. The decade of the 1990's was the warmest decade and 1998 was the warmest year on record. Click to enlarge.
The little ice age was during the 15'th to 19'th centuries.
Sea Level Rise
The NCDC says
"Global mean sea level has been rising at an average rate of 1 to 2 mm/year over the past 100 years, which is significantly larger than the rate averaged over the last several thousand years. Projected increase from 1990-2100 is anywhere from 0.09-0.88 meters, depending on which greenhouse gas scenario is used and many physical uncertainties in contributions to sea-level rise from a variety of frozen and unfrozen water sources."
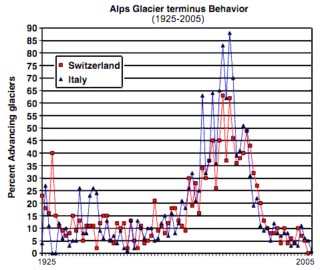
Glaciers
Temperate glaciers are retreating. Here is the graph of glacial advance versus retreat over the last 80 years. You can see that most of the time the glaciers were in fast retreat.
There are two different greenhouse effects: one that operates in the atmosphere called the Atmospheric Greenhouse effect and a different one that operates in greenhouses.
The atmospheric Greenhouse effect.
Certain molecules in the atmosphere absorb infrared radiation: water vapor, carbon dioxide, methane, and chlorofluorocarbons for example. They and the other constituents of the atmosphere such as nitrogen and oxygen do not absorb visible light. This means that visible light from the sun can be absorbed by the surface of the earth and converted into thermal energy, warming the surface. The the warm surface will emit longer wavelength far infrared radiation back out into space. The greenhouse gasses will then absorb this reemitted radiation warming the atmosphere and possibly reemitting infrared. However the reemitted infrared may be emitted toward the ground. In the absence of atmospheric greenhouse gasses the average temperature of the earth would be much colder,-18°C instead of the actual 14°C. So greenhouse gasses play an important and essential role in keeping the earth habitable.
The greenhouse greenhouse (sic) effect
The roof on a greenhouse prevents convection. Visible light from the sun enters the greenhouse and is absorbed warming the floor. The floor warms the air next to the floor. Without the greenhouse, the warm air would rise and carry away the thermal energy. However, the roof of the greenhouse prevents convection so the warm air stays near the ground. The same effect keeps your car warm on a sunny day.
The Greenhouse myth.
You may have heard that greenhouses work the same as the atmospheric greenhouse effect since glass is transparent to visible light and opaque to far infrared radiation. However experiments have been done in which greenhouses were made from thin plastic that is transparent to infrared radiation and they were just as warm as those covered in glass. This shows that limiting convection plays the most important role in real greenhouses.
|
Scientific Explorations with Paul Doherty |
|
22 April 2006 |